Manual Day Trading
Attach the Grey Trading Alpha (No lag) Script to the TradingView chart and switch to the Daily (D1) timeframe.
Brief Notes on how the Grey Trading Research Vol I strategy works
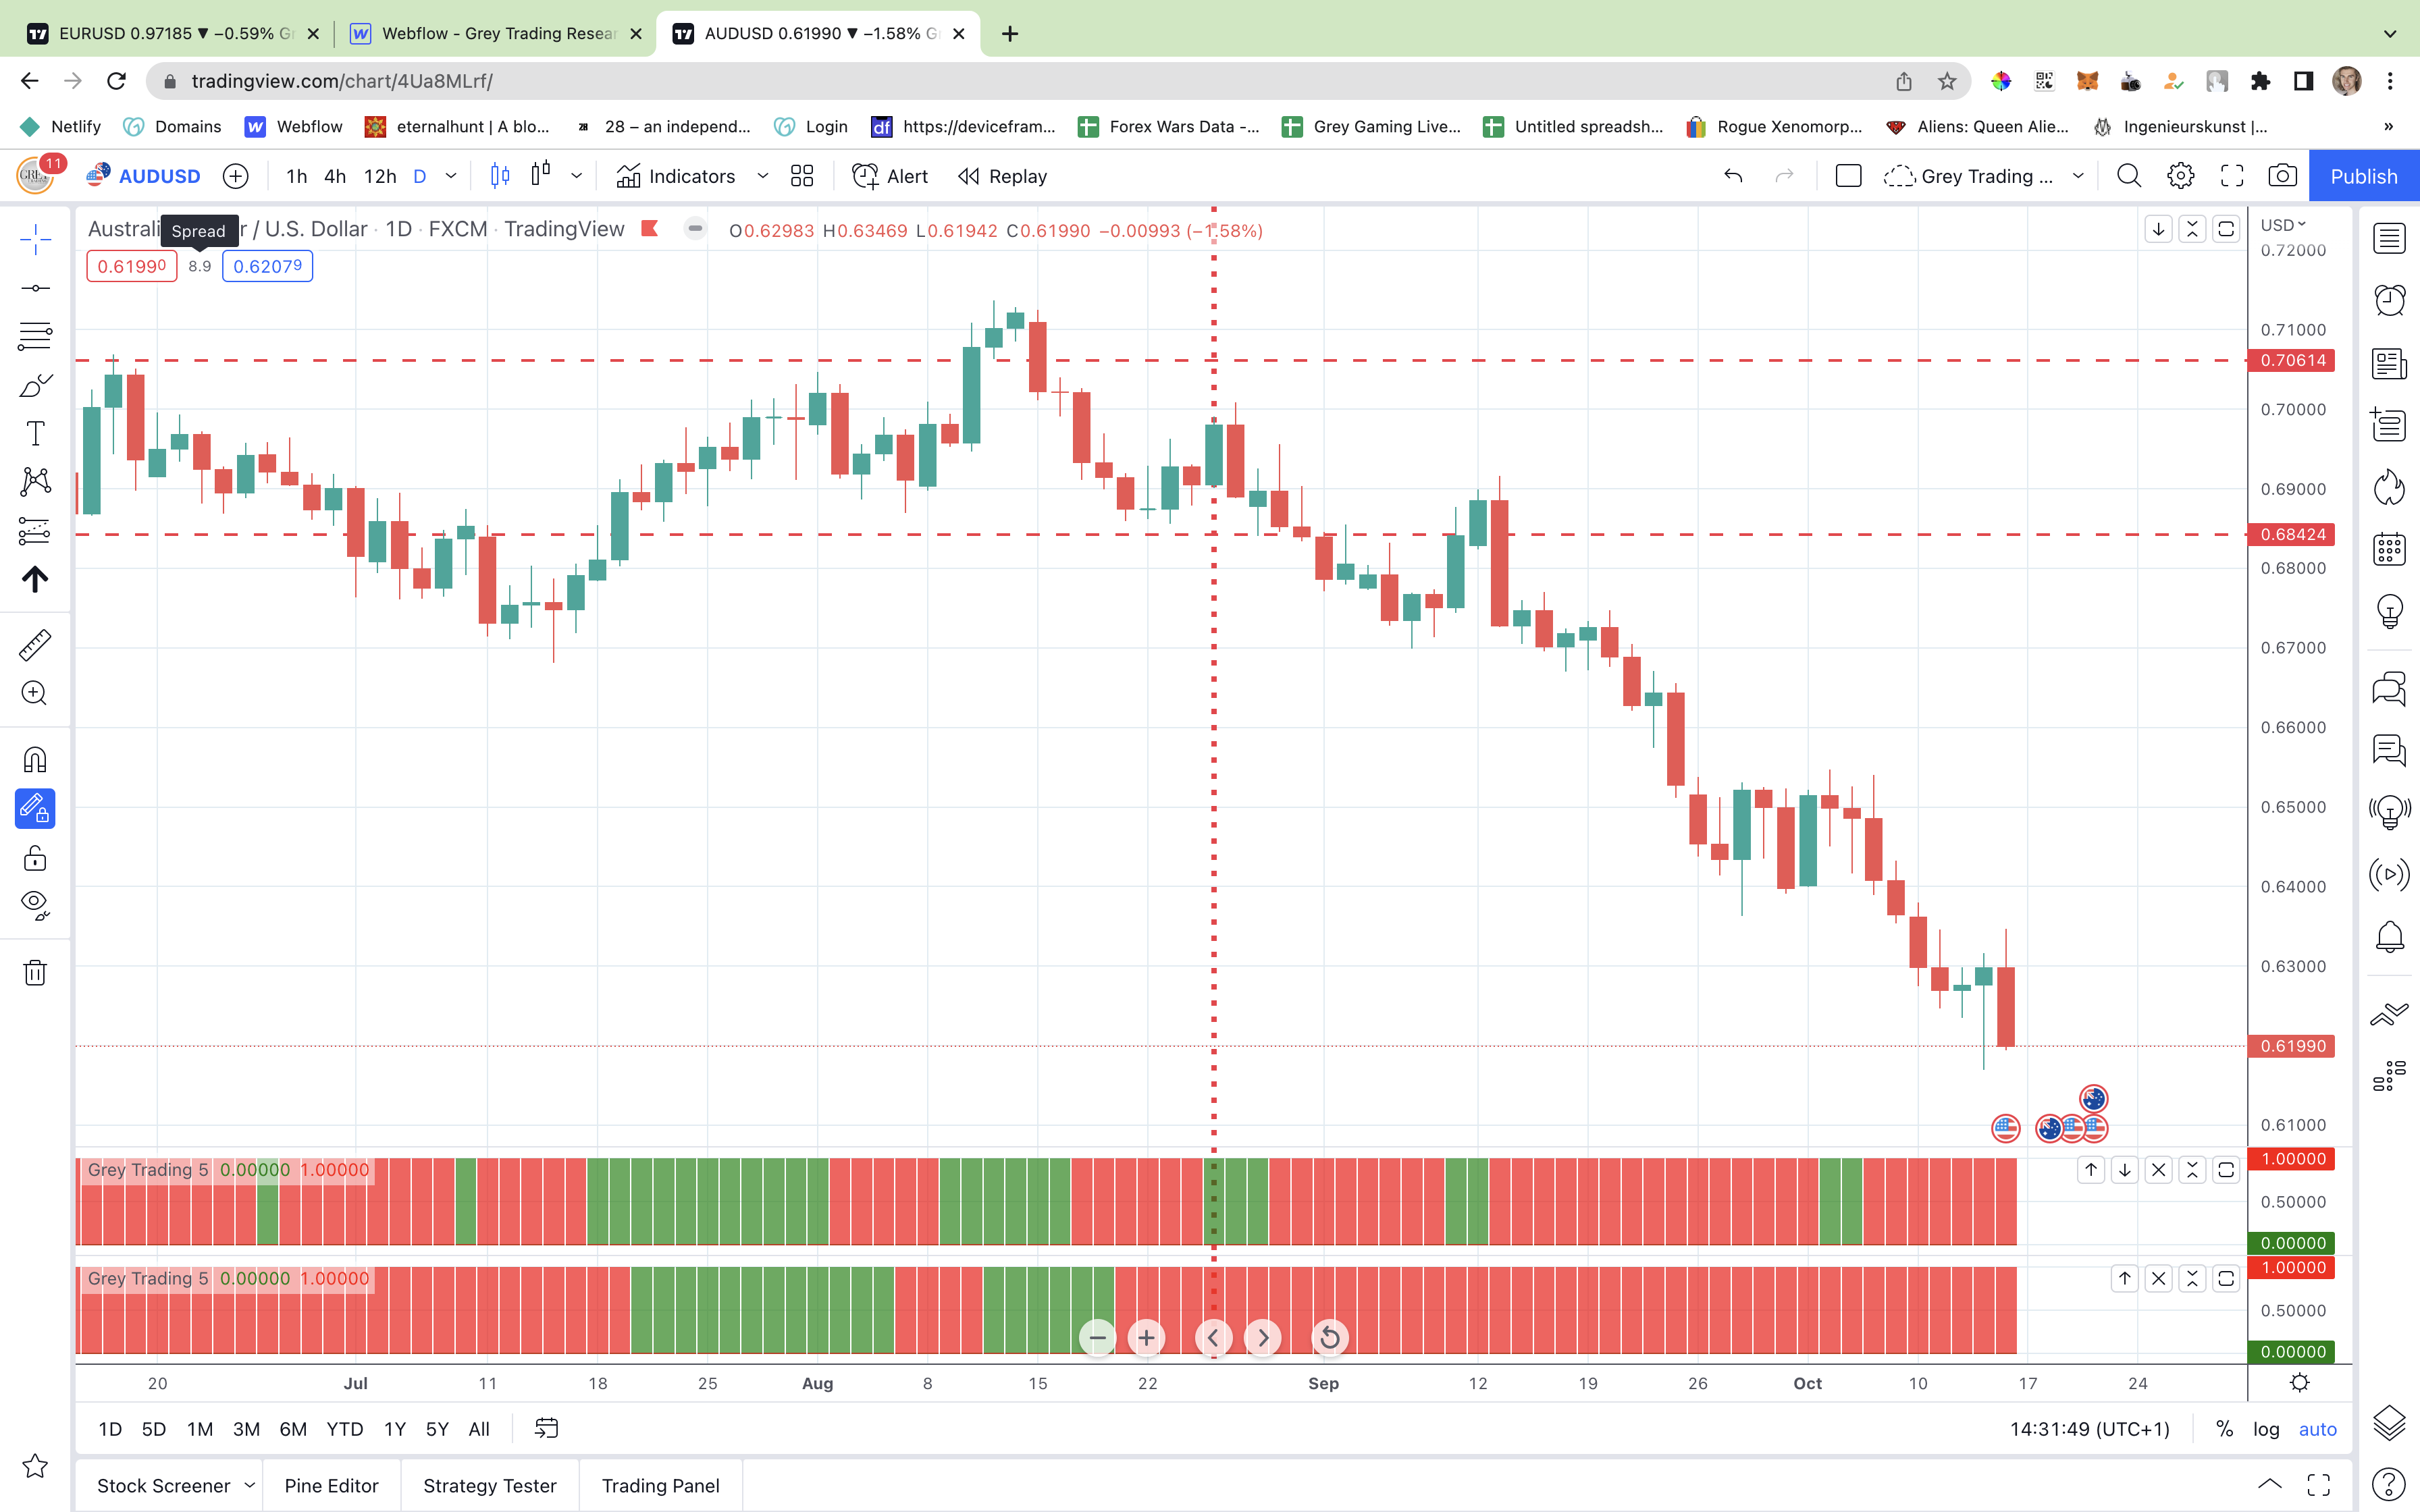
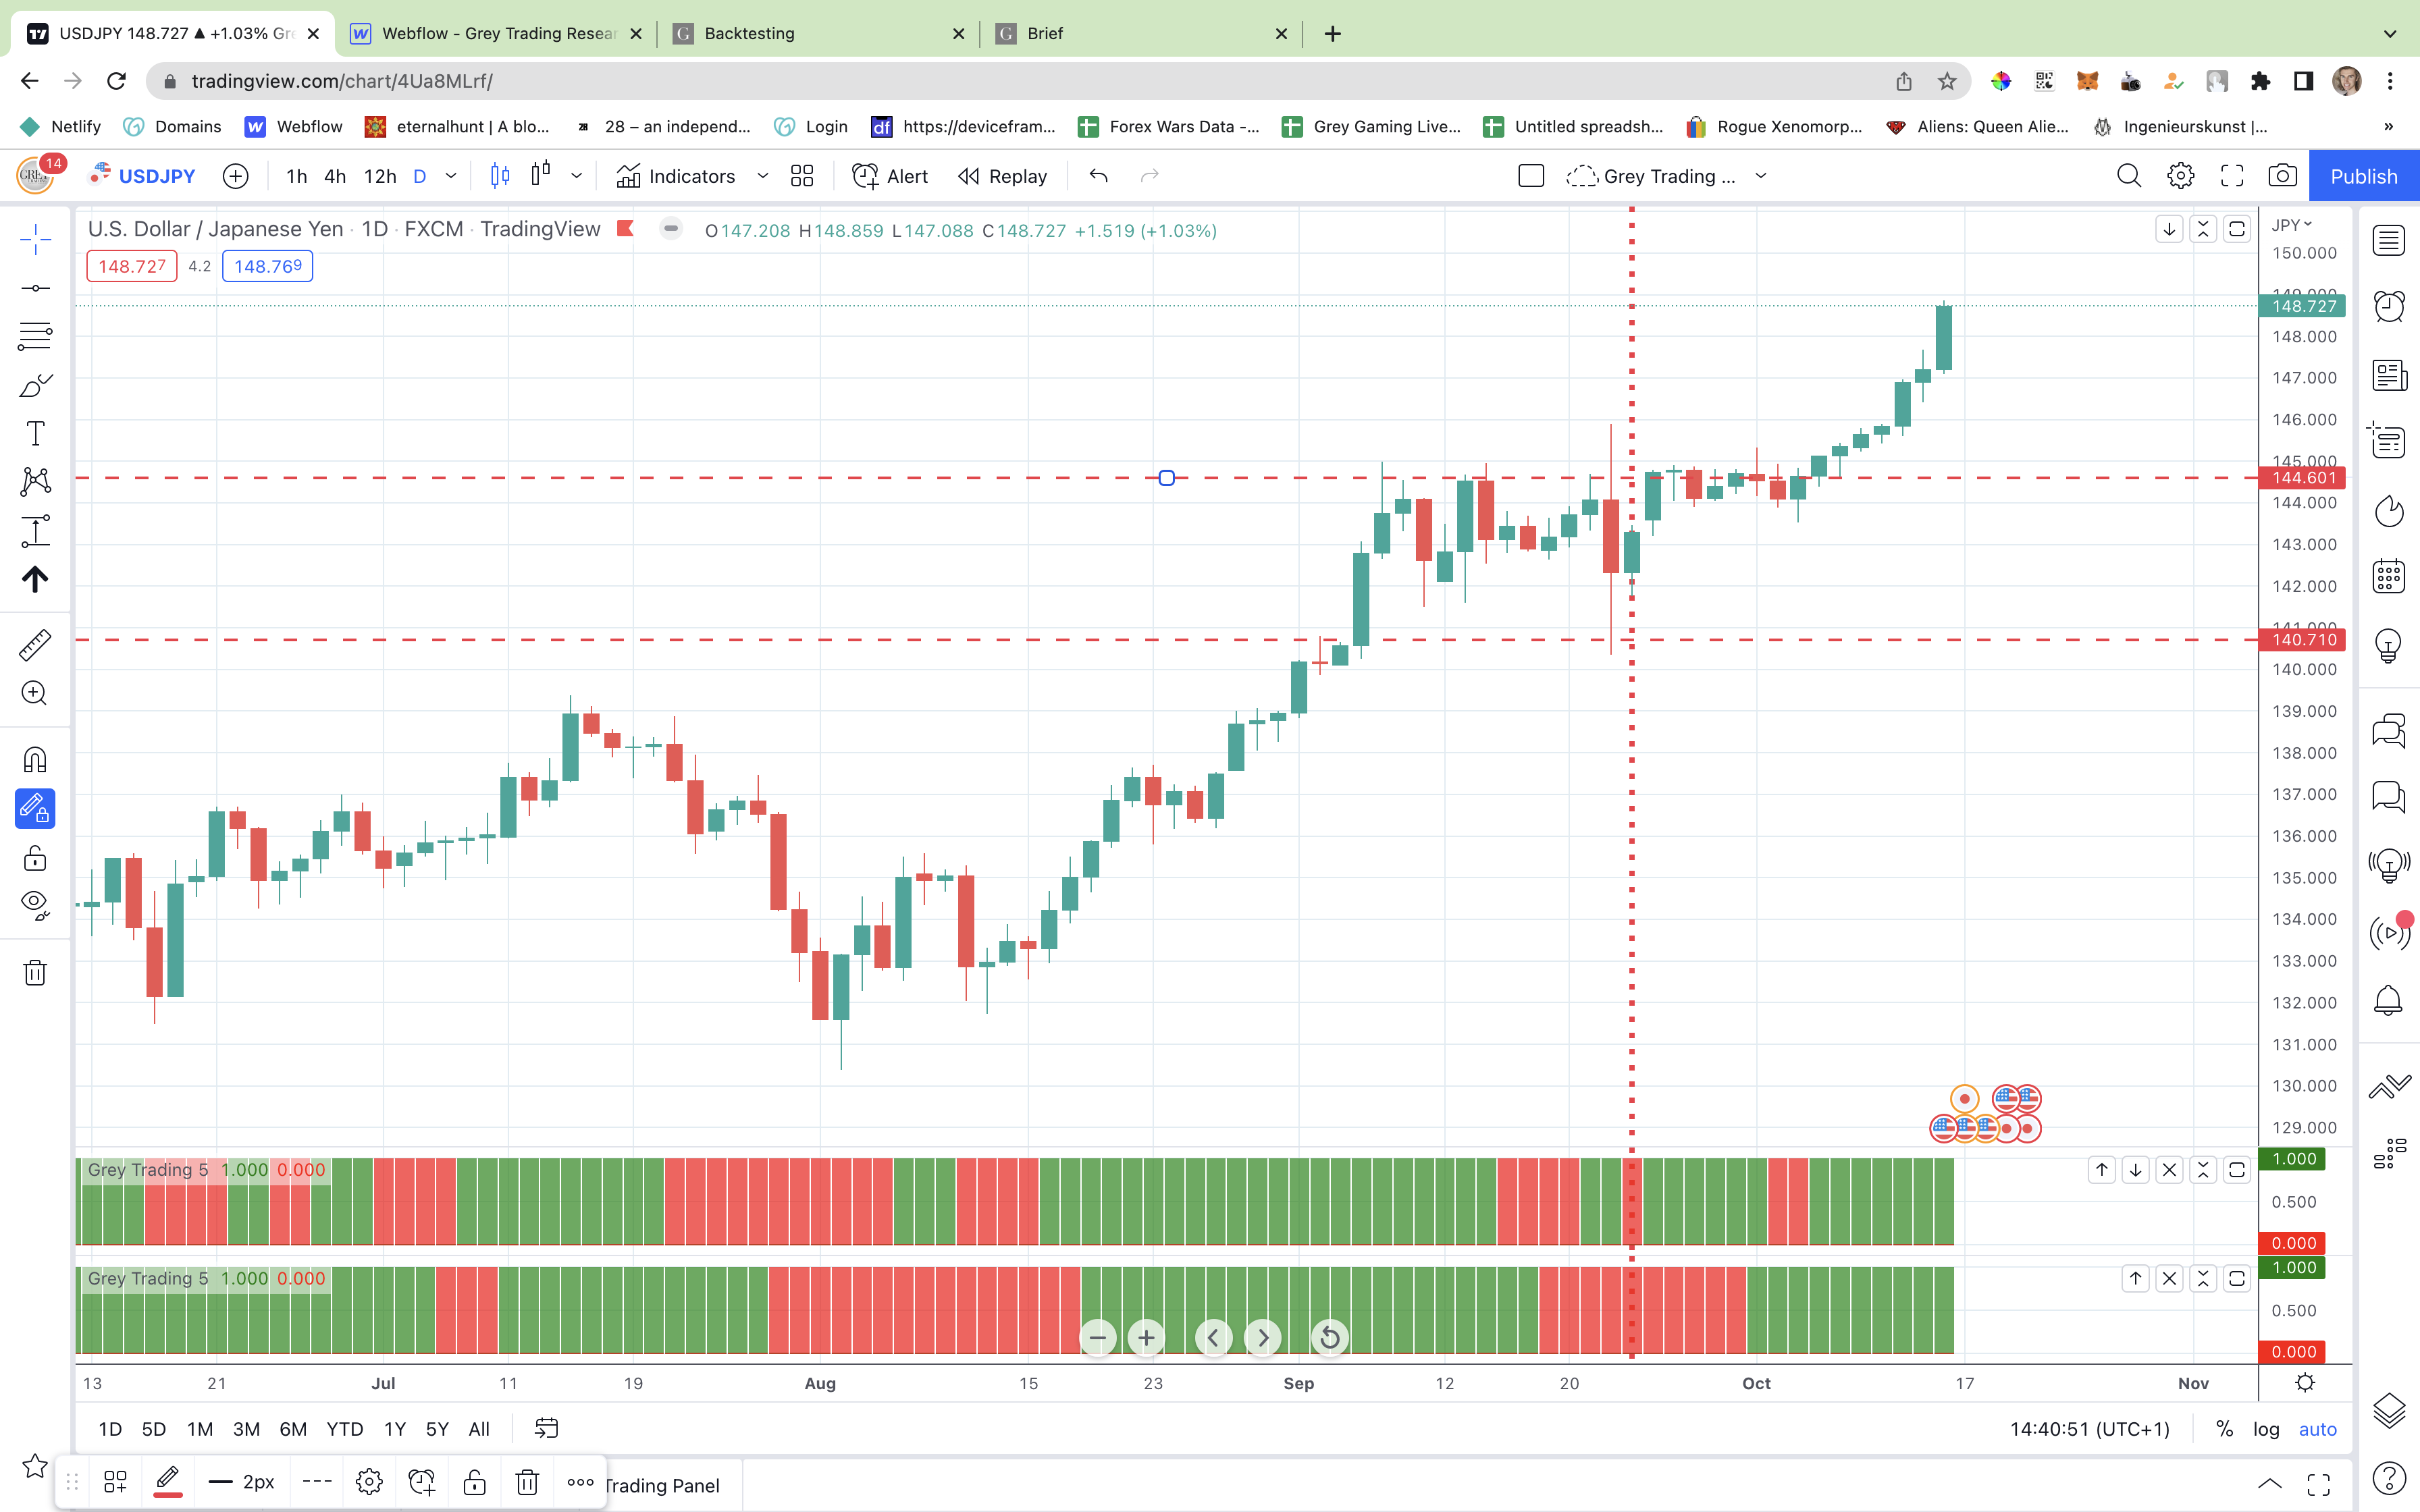
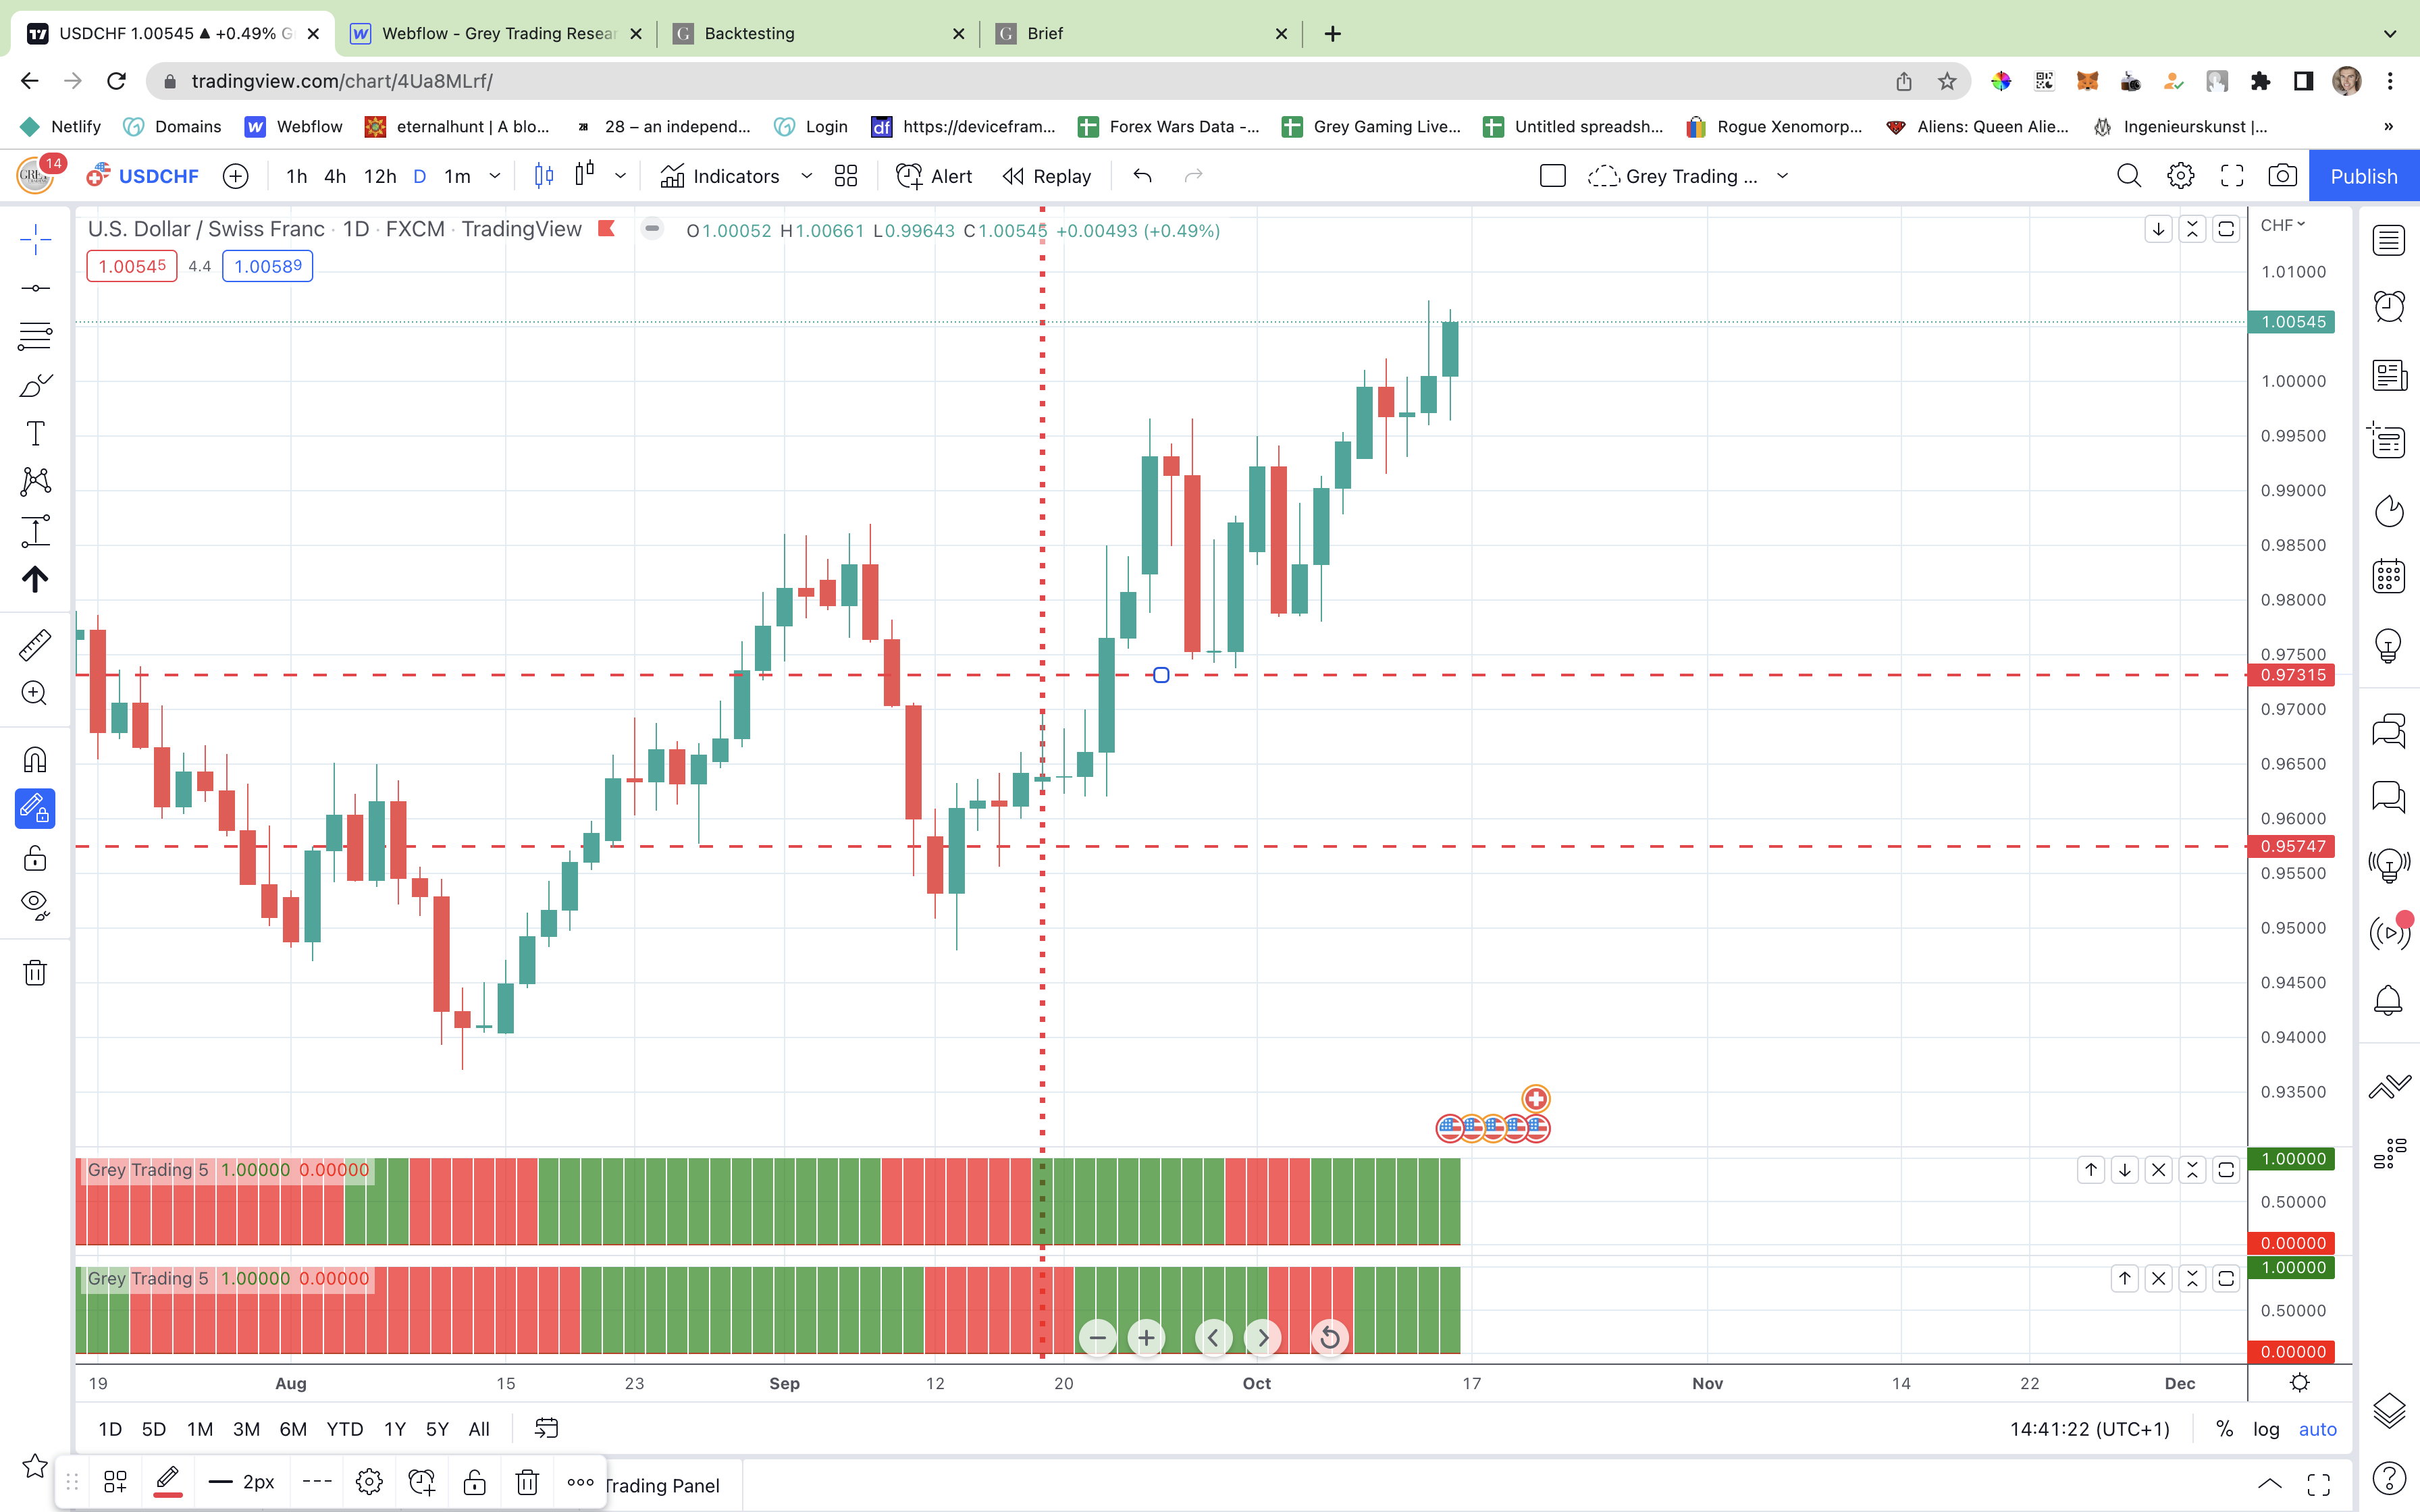
The Grey Trading Research Vol I uses the Alpha indicator on it's own and gives a faster signal by calculating buy levels and sell levels off when the indicator changes colour for the first time.
Buy Signal (Bullish candle) - Example: Today is a Tuesday 10pm London and the new D1 bar has just formed in Tradingview for Wednesday, the Alpha indicator is Green on Tuesday and Red on Monday so there has been a change in the signal. We now measure the total candle size from high to low of the changed colour candlestick (Tuesday). If the candlestick (high to low) is 1.50% we then place a pending buy order at half of the candlestick above the high and a sell order at half the candlestick below the low. So the pending buy order is at 0.75% the current price and the pending sell order would be at -2.25%. These pending orders stay on until one is hit. If one is hit we delete the other order. If a new signal forms we reset the pending orders at the new levels.
Sell Signal (Bearish candle) - Example: Today is a Tuesday 10pm London and the new D1 bar has just formed in Tradingview for Wednesday, the Alpha indicator is Red on Tuesday and Green on Monday so there has been a change in the signal. We now measure the total candle size from high to low of the changed colour candlestick (Tuesday). If the candlestick (high to low) is 1.50% we then place a pending sell order at half of the candlestick below the low and a buy order at half the candlestick above the high on Tuesday. So the pending buy order is at 2.25% the current price and the pending sell order would be at -0.75% below the current price. These pending orders stay on until one is hit. If one is hit we delete the other order. If a new signal forms we reset the pending orders at the new levels.
Once a pending order has been reached we know the current trend direction on the D1 timeframe. We then use the Grey Trading Omega indicator as usual on the H4 timeframe and H12 timeframe and place up a trade on each timeframe reading inline with our new D1 methodology.
Notes:
You can also use the Vol I Research method solely on the H4 and H12 timeframes but the main improvement in performance is realised on the D1 timeframe. The D1 timeframe is most critical to performance. For ease of trading it is recommended to just use Vol I Research on D1 timeframe and then trade inline with that direction on the H4 and H12 timeframes using the Omega indicator for entering the second and third trades.
Examples
Manual Day Trading
Attach the Grey Trading Beta (no lag) Script to the TradingView chart and switch to the Hourly (H1) timeframe.
Make sure you install Windows 32 bit Office and not Windows 64 bit Office. If you have installed Windows 64 bit you will need to remove this from your computer and reinstall the 32 bit version. Please note in the video it says 64 bit to install this is not correct.
Once Outlook is installed you will need to modify the VBA script as shown in the video training so it works for your MT4.
VBA Script last updated 21 October 2022

MT4 Indicators
Place in the MQL4/ Indicators directory
MT4 Expert Advisors
Place in the MQL4/ Experts directory
Set Up On Charts
Place the EA on the chart and enable live trading. Indicators do not need to be attached to the chart for the Expert Advisor to work.